
1. Executive Snapshot: The Year of the Paradox
The 2020 Denver real estate market was defined by a remarkable and historical paradox. What began as a global pandemic that initially paralyzed economic activity quickly evolved into the ultimate catalyst for a historic housing surge. Despite a complete temporary shutdown of the industry in the spring—where “stay-at-home” orders effectively halted physical showings—the year concluded with record-breaking price appreciation, a critical collapse in inventory, and a fundamental shift in homebuyer priorities across the 11-county metro area.
By December 31, 2020, the data from REcolorado® revealed a market that had not just recovered but had accelerated into uncharted territory. The most striking figure of the year was the 50.5% decrease in year-end active inventory. Denver entered 2021 with a mere 2,497 available homes, creating an environment of intense competition that favored sellers and pushed the market into a “multiple-offer frenzy” not seen in over 15 years.
Key 2020 Performance Metrics at a Glance:
- Median Sold Price: $450,000 (+7.1% YoY)
- Total Sold Listings: 63,324 (+7.5% YoY)
- Active Listings (Year-End): 2,497 (-50.5% YoY)
- Total Showings in Denver Metro: 1,409,150
- Average Percent of List Price: 100.0%
- Average Days on Market: 26 days
- New Listings: 70,056 (-1.7% YoY)
- Under Contract Listings: 65,713 (+4.9%)
This resilience highlights the “Teflon” nature of the Denver neighborhood markets, which absorbed a global health crisis and an economic shutdown only to emerge stronger and more expensive than ever before.
2. Detailed Narrative Analysis: The Pandemic Pivot
The “V-Shaped” Recovery and the Emotional Move
The 2020 calendar year for the Denver real estate market can be divided into three distinct phases: the traditional start, the pandemic paralysis, and the historic acceleration. The year began with standard seasonal momentum in January and February, with brokers preparing for a standard busy spring. However, the onset of COVID-19 in late Q1 brought the market to a near-standstill. Showings plummeted in April as health mandates were implemented, leaving many to wonder if the decade-long bull run in Denver real estate had finally met its end. For the first time in history, the “Spring Selling Season” was effectively postponed by government decree.
However, this period of dormancy was remarkably brief. By June, the market staged a dramatic “V-shaped” recovery. This was fueled by two primary engines: record-low mortgage interest rates (hovering near 3.0% or lower) and a sudden, urgent desire for more functional living spaces. As the “work-from-home” and “learn-from-home” era took hold, the American home was no longer just a place to sleep; it transformed into an office, a school, a gym, and a sanctuary. This cultural shift, combined with the financial leverage of historically low borrowing costs, motivated buyers to enter the market in unprecedented numbers, creating a backlog of demand that would persist through the holidays.
The Inventory Crisis: Why Supply Vanished
While buyer demand accelerated at a breakneck pace, seller activity struggled to keep up. Potential sellers were often hesitant to list their homes due to health concerns, the logistical difficulty of moving during a pandemic, or the fear that they would be unable to find a replacement home in such a tight market. New listings for the year actually decreased by 1.7% to 70,056, while “Under Contract” listings rose by 4.9%. This disconnect created a supply-demand imbalance of historic proportions.
This friction resulted in the total evaporation of standing inventory by December. When the supply of homes for sale drops by half in a single year while demand increases, the result is extreme upward pressure on prices. For those looking at buying Denver real estate, 2020 became a lesson in speed and financial decisiveness. Properties that would have sat for 45 days in 2018 were now disappearing in less than 48 hours.
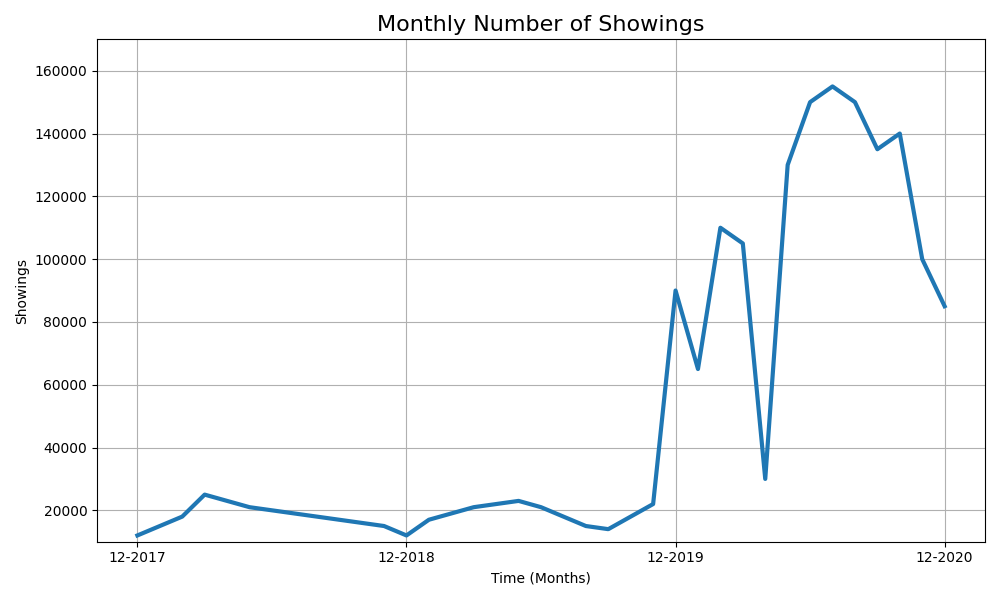
The Role of Showing Activity and Technological Adaptation
The sheer volume of interest was palpable. There were 1,409,150 total showings in the region in 2020. Interestingly, the peak showing activity month was December, a month that is traditionally slow for real estate. This indicated that the “buying season” had extended indefinitely. On average, properties required 16 showings before going into a pending status—a 60% increase from 2019, reflecting the sheer number of buyers competing for each individual listing.
Brokers and buyers also adapted through technology. Virtual tours, 3D floor plans, and sight-unseen offers became commonplace. This digital migration allowed the market to bypass traditional physical barriers, ensuring that the velocity of transactions remained high even during periods of social distancing.
3. Visual Data Interpretation: Price Range Dynamics
The 2020 data highlights a significant shift in market composition, specifically regarding which types of homes were moving and at what price points. We saw a “k-shaped” recovery in activity, where higher-end segments thrived while lower-end segments were constrained by a total lack of availability.
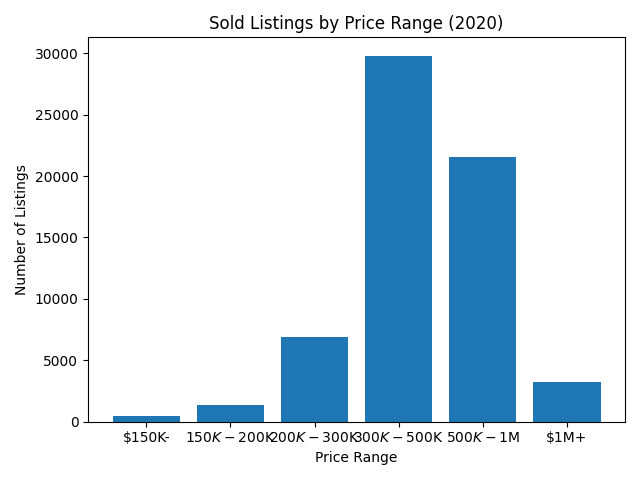
The Luxury Surge ($1M+)
The $1,000,001 and above price range saw the strongest one-year change in sold listings. High-net-worth buyers, many of whom were less impacted by pandemic-related job losses and more empowered by a soaring stock market, were the most active in upgrading their housing situations. Whether seeking luxury condominiums in Denver or sprawling estates in the foothills, this segment grew by over 40% in total volume as buyers sought to lock in low rates for high-value assets. The “luxury” label began to shift as well, as $1M became a standard entry point for many desirable neighborhoods in the city core.
The Disappearing Entry Level
Conversely, the $150,000 and below segment saw the weakest change, with a 30.1% decline in sold listings. This decline was not due to a lack of buyers, but rather a total lack of inventory. Homes at this price point are becoming functionally extinct in the Denver Metro area. Similarly, the $200,000 to $300,000 range saw a significant drop in volume as prices were pushed upward into the next bracket. For first-time buyers, the “barrier to entry” was raised significantly in 2020, forcing many to look toward attached dwellings or further out into the suburbs.
The Engine of the Market: $300k – $500k
The $300,001 to $500,000 range remained the primary engine of the market, accounting for 29,804 sold listings. This bracket also boasted the shortest average days on market at just 20 days. This “sweet spot” of the Denver market trends represents the most competitive territory for first-time and move-up buyers alike. In this bracket, the average sales-to-list-price ratio often exceeded 101%, indicating that the majority of these homes were sold above the asking price.
4. Buyer & Seller Perspective: Navigating the 2020 Gauntlet
The Seller’s Absolute Advantage
In 2020, Denver sellers regained total control of the narrative. On average, sellers received 100% of their original list price, an increase from 99.2% in 2019. In competitive suburban micro-markets, it was common for homes to sell for 103% to 105% of the list price after multiple-offer situations. For those considering selling a home in Denver, the velocity of the market became the primary challenge; while a home would sell in days, finding the next home was a daunting task, leading to many sellers negotiating “post-closing occupancy” agreements to give them time to find their next residence.
The Buyer’s Struggle: Forfeiting Contingencies
For buyers, 2020 was a year of “hurry up and wait.” While mortgage rates made monthly payments more affordable, the psychological toll was high. Buyers had to be “offer-ready” within hours of a listing hitting the REcolorado® system. In the $300k-$500k range, competition was so fierce that many buyers began waiving contingencies—such as appraisals or inspections—to make their offers stand out. This trend, which began as a necessity in 2020, would eventually become a standard baseline in the following year. Buyers were no longer just competing on price, but on terms, risk tolerance, and speed.
5. Neighborhood & Micro-market Trends: The “Push” Outward
The 2020 data highlights a significant move toward the outskirts of the metro area and the foothills, as buyers sought lower density and more “elbow room.” This “de-urbanization” trend was not a total abandonment of the city, but a strategic expansion of what buyers considered “commutable.”
Exurban High-Growth Areas
Areas like Kiowa (+27.6%) and Idaho Springs (+24.0%) saw some of the highest increases in median sold prices. These “exurban” areas became viable for professionals who no longer had to commute to downtown Denver daily. Similarly, Morrison saw a 20.7% jump in median price, reflecting the premium placed on proximity to outdoor recreation and larger lot sizes. If you are looking to move, our Denver relocation guide can help you navigate these shifting trends.
| Association | Sold Listings | YoY Change | Attached Share | Days on Market | % of List Price |
|---|---|---|---|---|---|
| Denver Metro (DMAR) | 63,327 | +7.5% | 28.8% | 22 | 100.0% |
| Aurora (AAR) | 62,561 | +7.6% | 28.0% | 22 | 100.0% |
| Mountain Metro (MMRA) | 12,323 | +10.1% | 24.8% | 24 | 100.2% |
| South Metro (SMDRA) | 58,568 | +7.3% | 29.5% | 23 | 100.0% |
6. Historical Comparison & Economic Context
The Disappearing Inventory Trend: A 5-Year Look
Looking at a 5-year trend, the inventory collapse of 2020 is unprecedented. In 2018, there were 5,780 active listings at year-end. In 2019, that number was 5,037. By the end of 2020, that number had plummeted to 2,497. This represents a fundamental shift in the Denver real estate market from a “tight” market to a “severely undersupplied” market. This lack of supply has created a baseline of appreciation that will take years of new construction to normalize.
The “Safety Net”: Forbearances and Equity
Despite early pandemic fears of an economic collapse similar to the 2008 Great Recession, the 2020 market proved far more stable. Lender-mediated sales accounted for only 0.5% of the total market. This was due to extensive government forbearance programs and the rapid appreciation of home equity, which allowed struggling homeowners to sell traditionally rather than face foreclosure. Homeowners who are curious about their equity gains should use our home valuation tool to see how the 2020 surge impacted their specific property.
2020 Monthly Market Reports
Want to see how the market is performing today?