Denver Housing Market Trends: December 2019 Insights
See below for our full report for December 2019 and please let us know if you have any questions. We email this market infographic report on the Denver Real Estate Market each month. To get on the email list, please reach out to marketing@usajrealty.com and request to be added.
Update on the Denver Housing Market
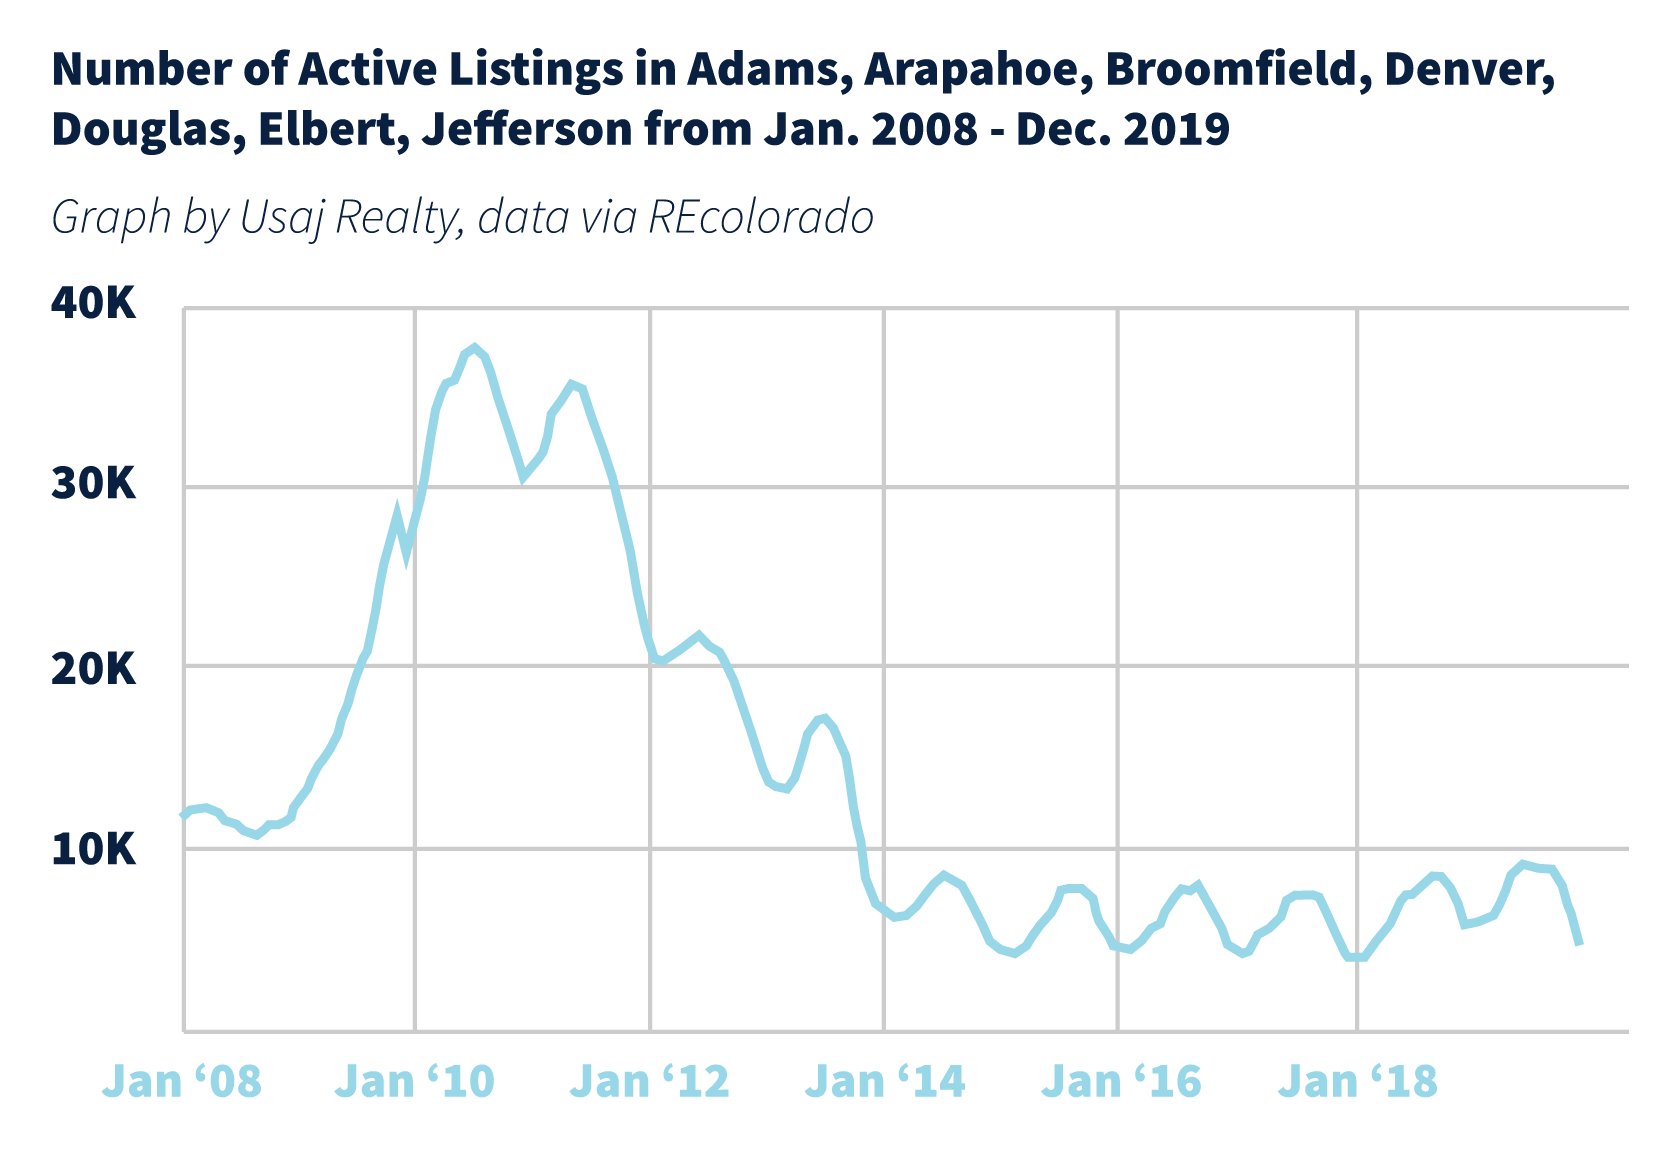
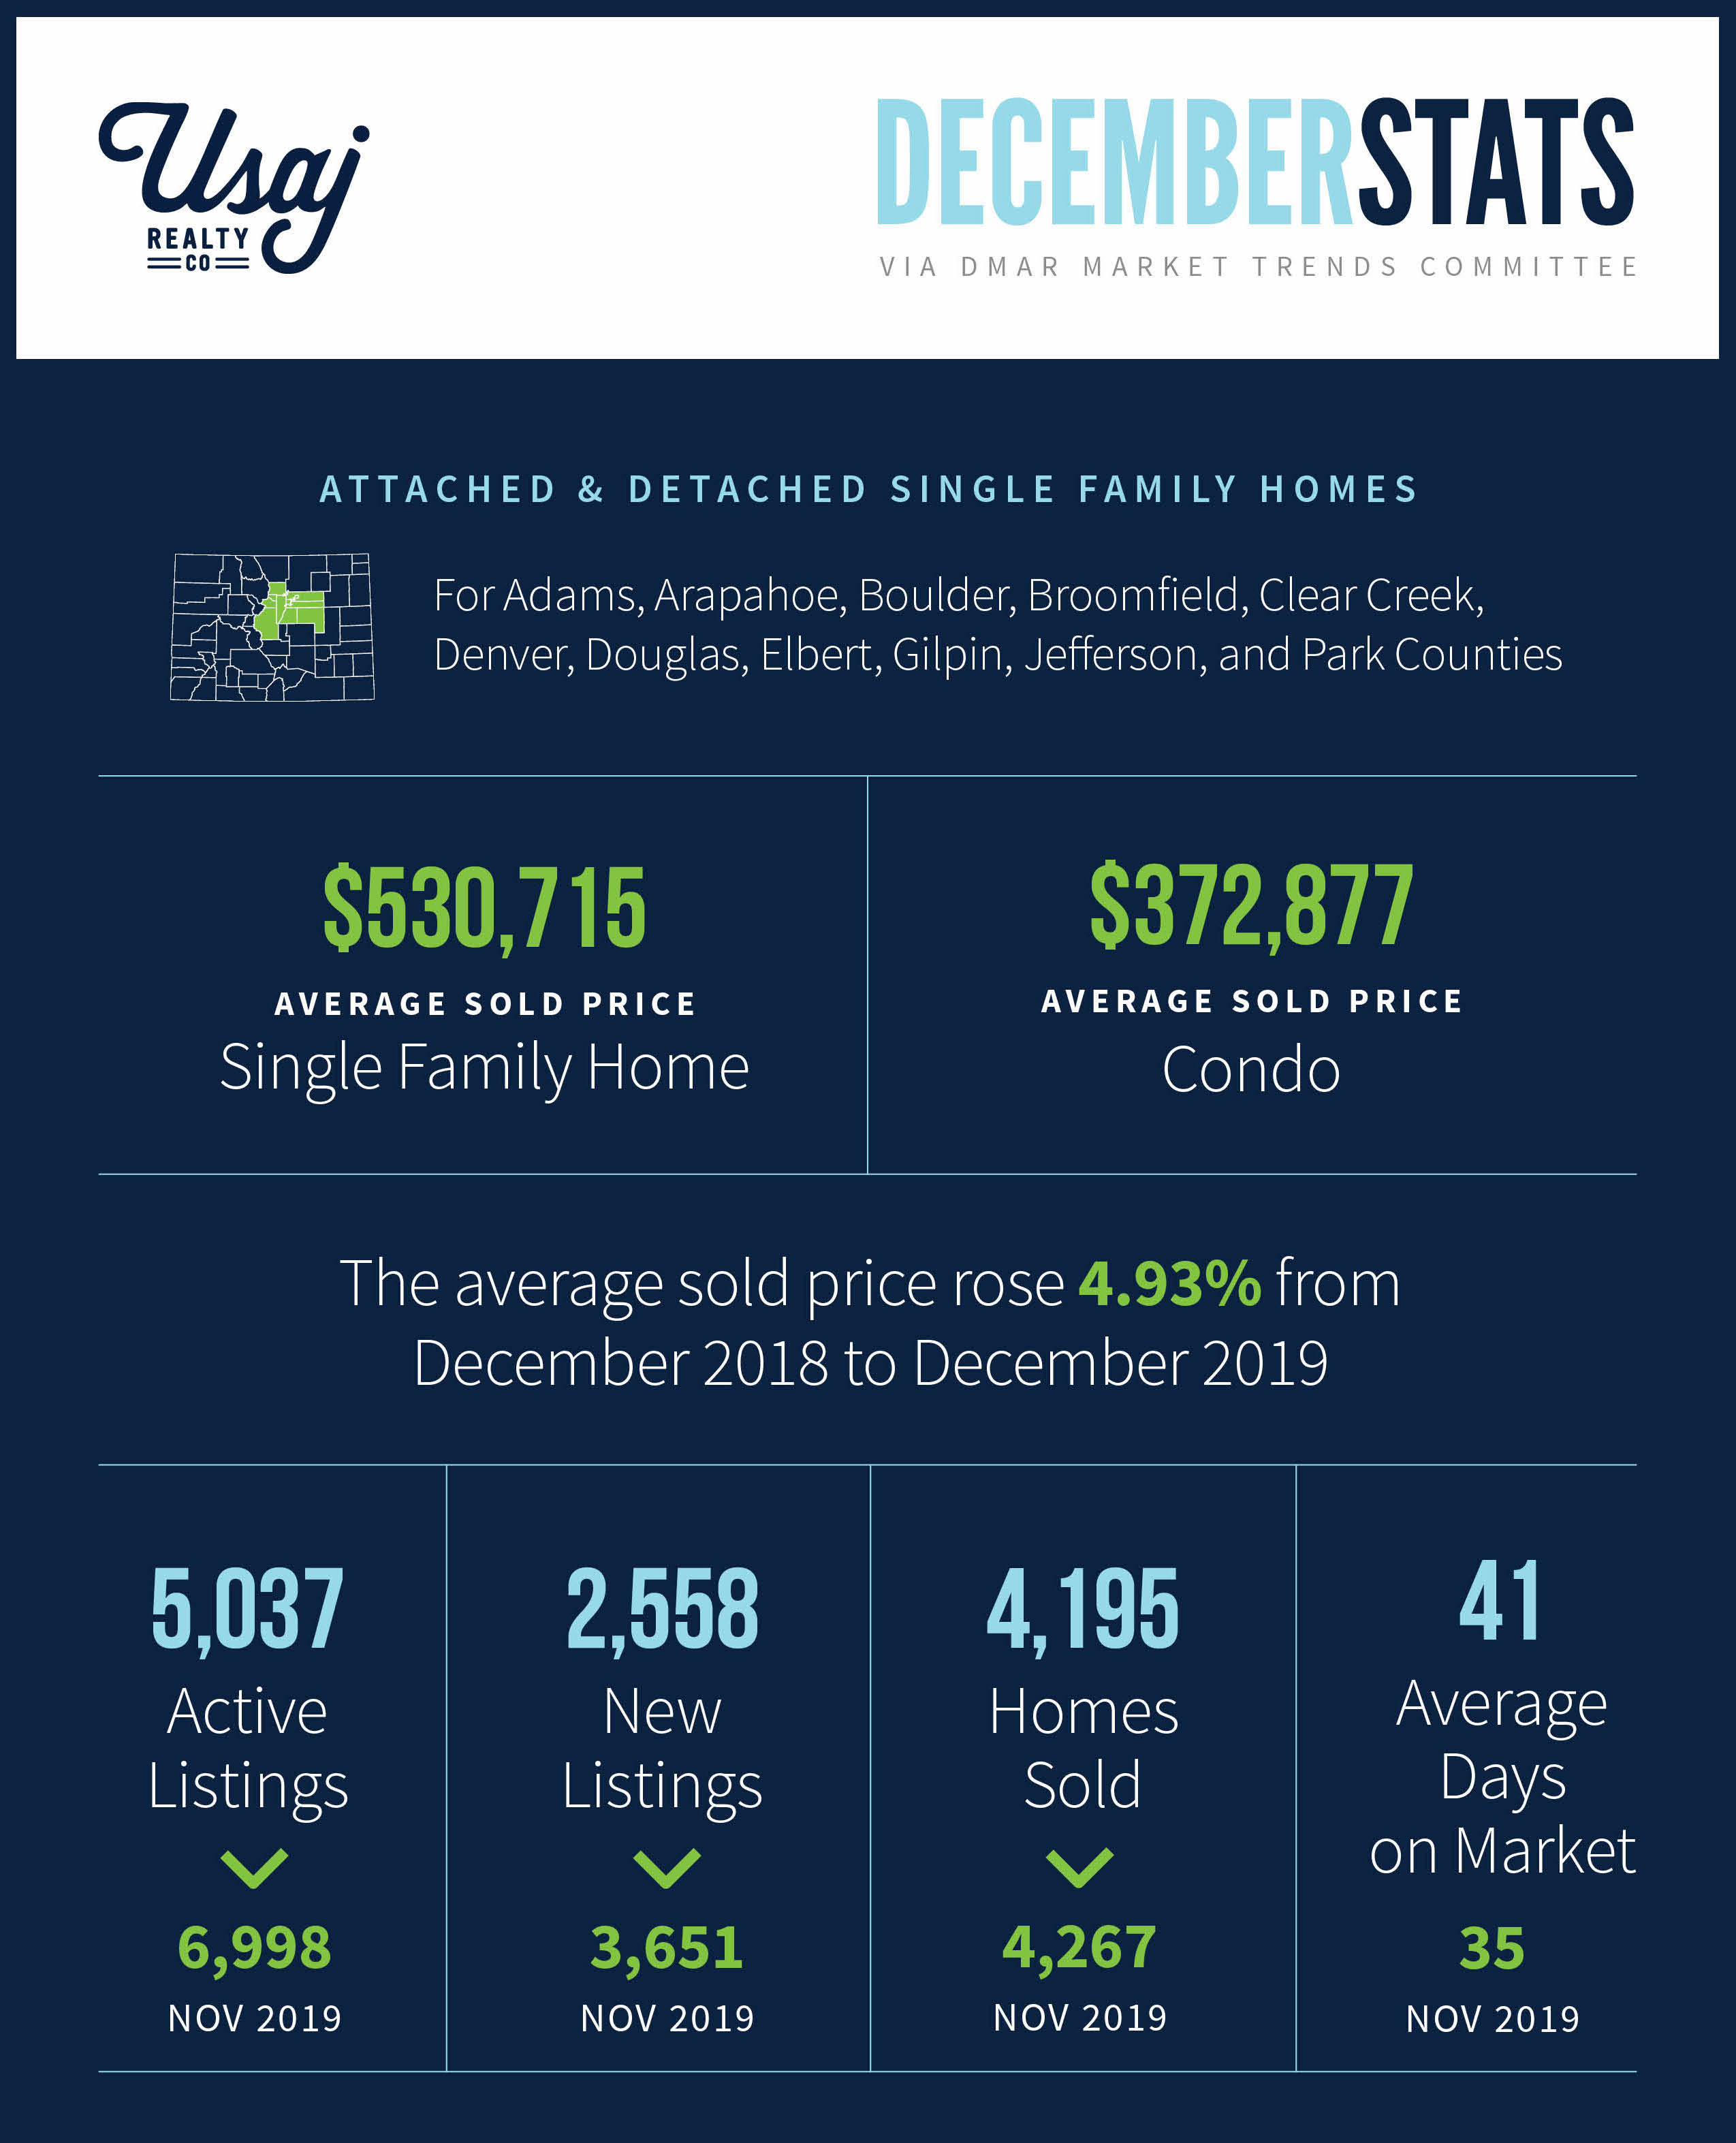
Last month in Denver, supply tanked and demand stayed relatively strong. For the sixth month in a row, the number of active listings was down month-over-month. 2019’s inventory peaked in June with 9,520 active listings and sank to an annual low of 5,037 in December. According to DMAR, “the main reason we saw fewer choices was not because more [homes] were going under contract or selling, but because 29.94 percent fewer new listings came on the market in December compared to the month prior.”
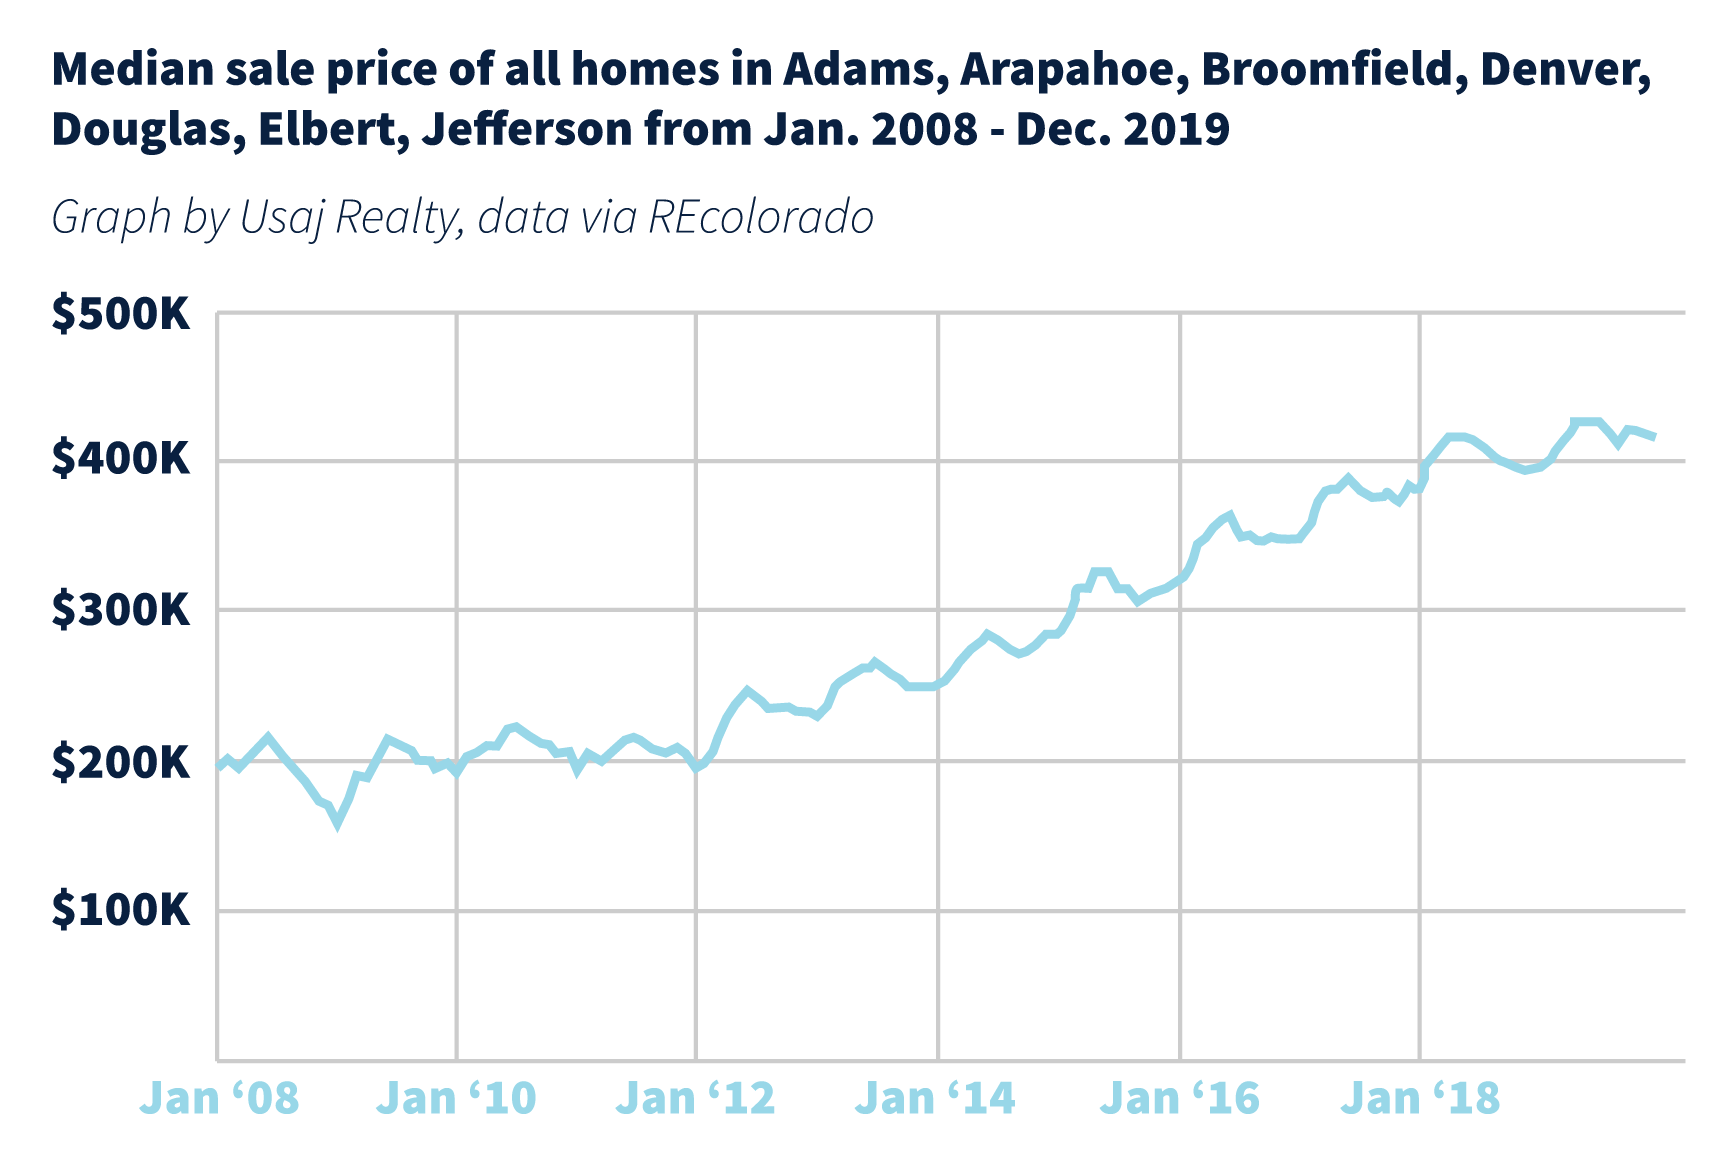
While we aren’t seeing the 9 percent appreciation rates of years past, it is true that home prices continued to go up in the metro area in 2019. The price of single-family homes increased by an average of 4.99 percent from this time last year, and condos’ average price rose by 7.38 percent.
The average sold price for a single-family home in metro Denver for December was $530,715 and the average sold price for a condo was $372,877.
Home Buyer Purchasing Power is Up
“The median home price in Denver County has grown 7.1% in the past year while wages have only grown 4.1%,” according to the Bureau of Labor Statistics and sales data collected by ATTOM” (Denver Business Journal). However, home buying power is higher now than it was even a year ago, thanks to low mortgage rates and increasing wages.
According to DMAR, “just over a month ago, over 55 percent of economists believed the recession would happen in 2020. Now only 34 percent believe it will happen in 2020, 29 percent believe 2021 and 14 percent say 2022”.
Low Home Sales Nationwide
Historically low interest rates may be having an unintended side effect: home owners purchase their home with a very low rate or existing home owners refinance for a great rate, potentially financially disincentivizing them from selling in the future (First American). Homeowners across the country are remaining in their homes about 13 years, five years longer than they did in 2010. “More homeowners staying put has helped cause housing inventory to dwindle to its lowest level in decades, which has also helped push up prices on homes for sale. Adjusted for population, the inventory of homes for sale is now near the lowest level in 37 years of record-keeping, according to housing-data firm CoreLogic Inc,” (Wall Street Journal).

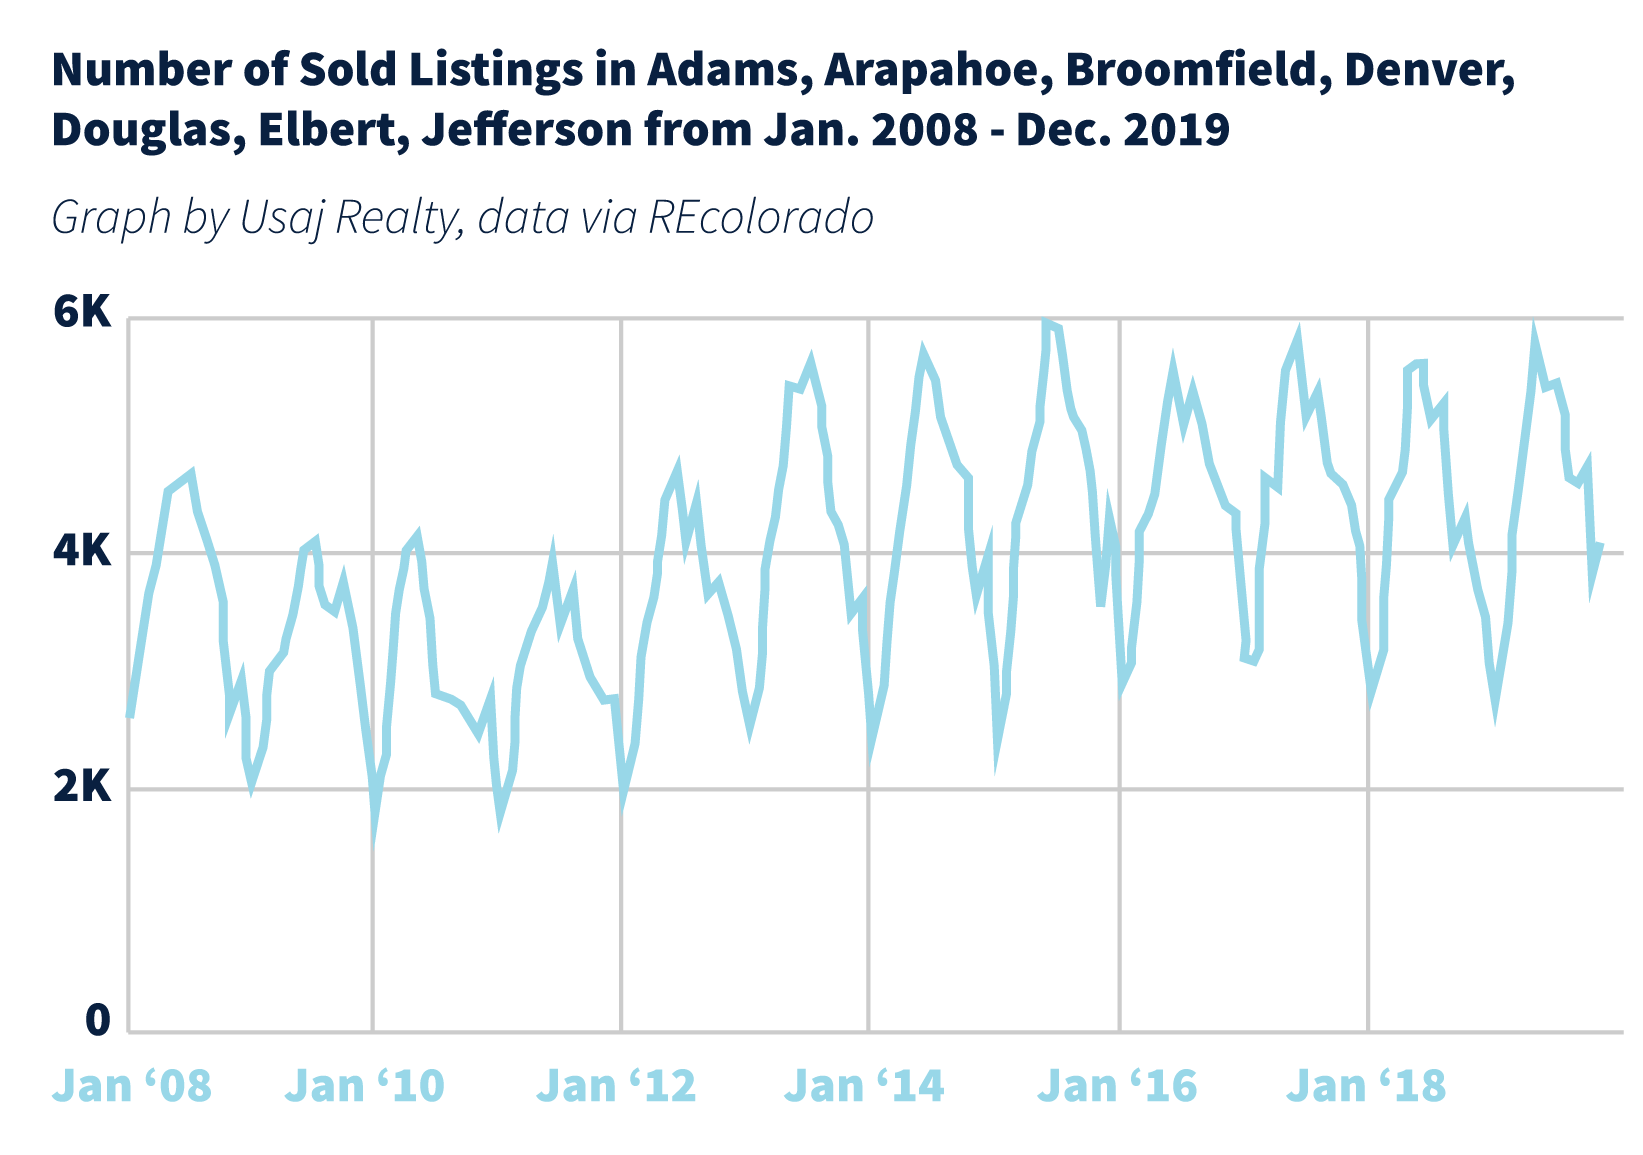
The number of days on the market leaped to 41, up from November’s 35. Overall in 2019, we saw a 19 percent jump in days on market compared to the three years prior, meaning homes are taking longer to sell. This leads to more price reductions, yet in spite of this, home prices continued to go up in 2019. The average sold price in 2019 was $486,695, a 2.85 percent increase from 2018 (DMAR).
The seasonality trend continues for active listings as shown in the chart below:

Read next: What Will the Housing Market Do in 2020?
If you are weighing your options of buying or selling in the new year, a Usaj Realty broker would be happy to assist you in expertly navigating the Denver market. Many factors go into deciding what could be right for your particular situation, so sitting down with an expert can be a great opportunity to discover the best route for you.

Key takeaways for December 2019 via DMAR:
Stats below include data for Adams, Arapahoe, Boulder, Broomfield, Clear Creek, Denver, Douglas, Elbert, Gilpin, Jefferson, and Park Counties
- Active Inventory in December 2019: 5,037
- November 2019: 6,988
- October 2019: 8,557
- September 2019: 9,286
- August 2019: 9,350
- July 2019: 9,359
- June 2019: 9,520
- May 2019: 8,891
- April 2019: 7,012
- March 2019: 6,292
- February 2019: 6,017
- January 2019: 5,881
- December 2018: 5,577
- November 2018: 7,530
- October 2018: 8,539
- September 2018: 8,807
- August 2018: 8,228
- July 2018: 7,643
- June 2018: 7,436
- May 2018: 6,437
- April 2018: 5,160
- March 2018: 4,619
- February 2018: 4,084
- January 2018: 3,869
- December 2017: 3,854
- November 2017: 5,131
- October 2017: 6,312
- September 2017: 7,586
- August 2017: 7,360
- Median Sold Price for a condo in Denver metro in December 2019 was: $308,788
- November 2019: $312,000
- October 2019: $306,875
- September 2019: $312,000
- August 2019: $310,000
- July 2019: $312,000
- June 2019: $310,000
- May 2019: $315,000
- April 2019: $305,000
- March 2019: $300,000
- February 2019: $297,500
- January 2019: $290,000
- December 2018: $298,225
- November 2018: $299,450
- October 2018: $299,250
- September 2018: $301,625
- August 2018: $299,000
- July 2018: $300,000
- June 2018: $305,000
- May 2018: $306,331
- April 2018: $297,000
- March 2018: $295,000
- February 2018: $296,000
- January 2018: $285,000
- December 2017: $285,000
- November 2017: $272,000
- October 2017: $275,000
- September 2017: $268,000
- August 2017 $275,000
- July 2017: $270,100
- Median Sold Price for a single-family residence in Denver metro in December 2019 was: $450,000
- November 2019: $453,250
- October 2019: $456,000
- September 2019: $450,000
- August 2019: $459,900
- July 2019: $469,912
- June 2019: $465,000
- May 2019: $470,000
- April 2019: $460,000
- March 2019: $450,000
- February 2019: $430,100
- January 2019: $425,000
- December 2018: $430,000
- November 2018: $427,000
- October 2018: $435,000
- September 2018: $428,000
- August 2018: $445,000
- July 2018: $450,000
- June 2018: $452,500
- May 2018: $450,000
- April 2018: $455,000
- March 2018: $440,875
- February 2018: $435,000
- January 2018: $416,000
- December 2017: $415,000
- November 2017: $405,000
- October 2017: $415,000
- September 2017: $409,000
- August 2017: $410,000
- July 2017: $420,000
In the News: What’s Happening in Denver
“The multifamily and industrial markets are particularly ripe for investors right now, as the city continues to attract large corporate players and the talent that comes with them…The market remains strong for industrial demand, panelists said, particularly when it comes to financing new projects. So far, investors who have bet on Denver industrial have seen strong returns.”
– BisNow
An average worker can’t afford a median-priced home in the Denver metro
“…an average wage earner in Denver County making $72,215 a year would need to spend 42% of their monthly salary to afford the median-priced home there ($443,500). The median home price in Denver County has grown 7.1% in the past year while wages have only grown 4.1%, according to the Bureau of Labor Statistics and sales data collected by ATTOM.”
DMAR Market Trends | Expert Opinion Prediction on 2020
“I guess [that in 2020] affordability will continue to be an issue in the Denver metro area as the cost of land and new construction increased with our home prices and most salaries didn’t keep pace. I guess [that in 2020] buyers will continue to want more and more as they pay more and more. I guess sellers are going to have to do more to get their homes in tip top shape to get top dollar. And when I consider we are starting the new year with low inventory, low interest rates, a strong job market and a steady economy, I feel safe guessing we will see continued long-term gains in real estate.”
In the News: What’s Happening Nationally
“In 2019, consumer house-buying power, how much home one can afford to buy given household income and the prevailing mortgage rates, surged and provided a significant boost to housing market potential. Since the start of 2019, income has grown by 1.9 percent and mortgage rates have fallen by 0.77 percentage points, both dynamics sending house-buying power higher. As a result, house-buying power jumped 12.0 percent between January and October 2019.”
– First American Title
People Are Staying in Their Homes Longer—a Big Reason for Slower Sales
“Homeowners nationwide are remaining in their homes typically 13 years, five years longer than they did in 2010, according to a new analysis by real-estate brokerage Redfin. When owners don’t trade up to a larger home for a growing family or downsize when children leave, it plugs up the market for buyers coming behind them.”
Impact on 2020 Outlook
” Mortgage rates are currently hovering at 3.7 percent, and forecasters currently expect rates will remain somewhere between 3.7 percent to 3.9 percent in 2020 – still near historical lows. Meanwhile, household income is expected to continue to grow as wages rise. It’s possible that house-buying power in 2020 may dip lower than in the spring and summer of 2019, but will likely remain near historical highs.”
– First American Title
Report for December 2019:

Read Denver Metro Association of Realtor’s full report on last month’s Real Estate trends and statistics in Denver here.
And as always, please let us know if you have any questions


