Denver Housing Market Trends: November 2018 Report
See below for our full report for November 2018 and please let us know if you have any questions. We email this market infographic report on the Denver Real Estate Market each month. To get on the email list, please reach out to info@usajrealty.com and request to be added!
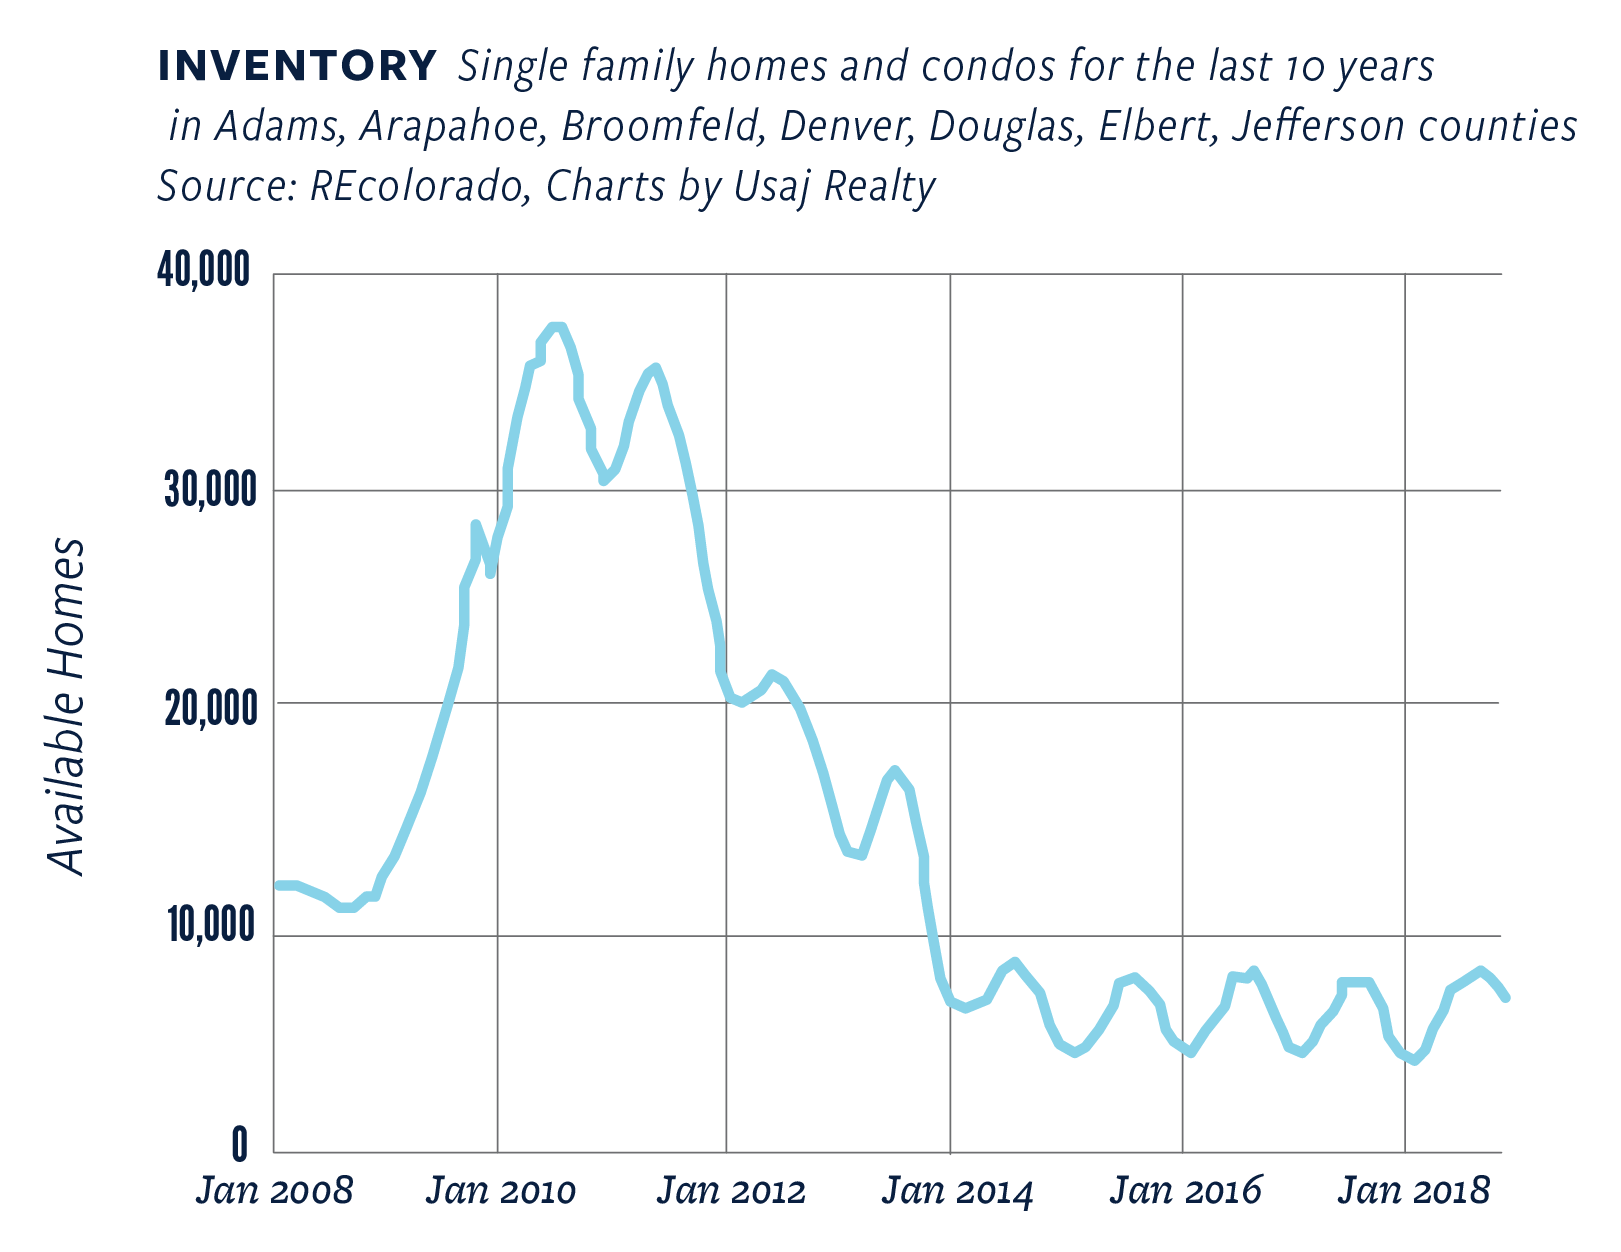
In September we saw the highest inventory for 2018, with 8,665 active listings.
It has since decreased each month with 8,420 active listings in October, and 7,273 in November. This is an important number to watch for those worried about a bubble. Predictions for 2019 are starting to trickle in and a recent survey asked 100 real estate economists and investment experts what cities they thought were going to outperform the growth of nationwide home values, and Denver was second only to Washington D.C. (Denver Business Journal).

See the trends for the last 10 years in regard to inventory:

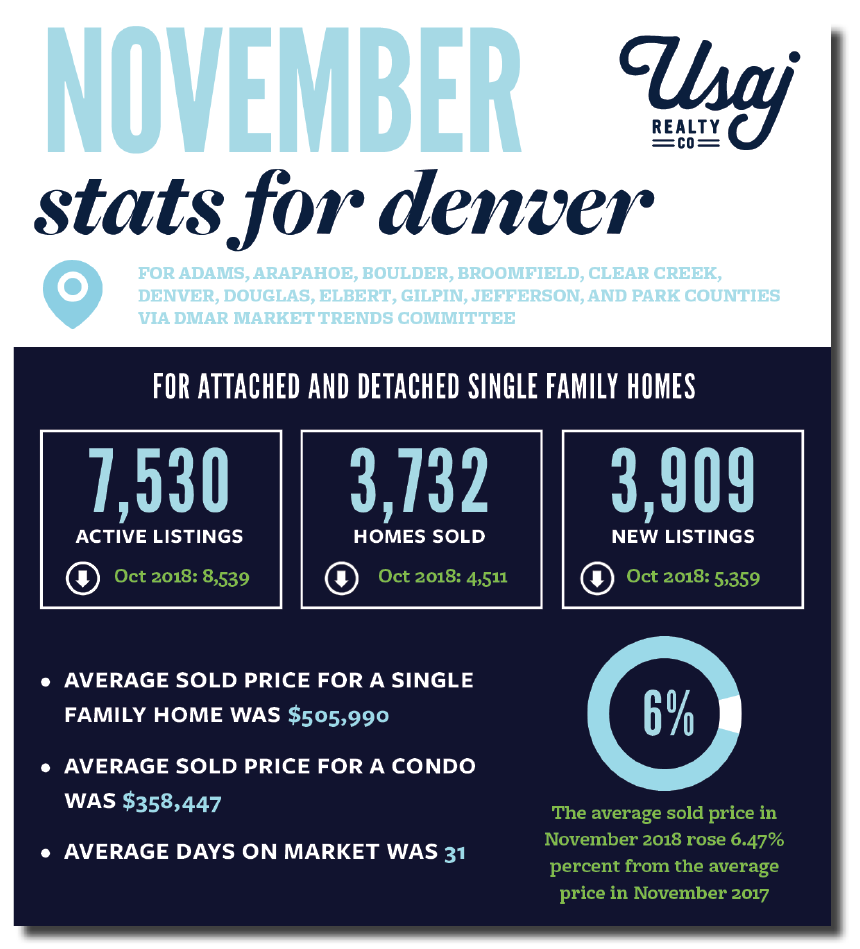
Key Takeaways for November 2018 via DMAR for Metro Denver
Stats below include data for Adams, Arapahoe, Boulder, Broomfield, Clear Creek, Denver, Douglas, Elbert, Gilpin, Jefferson, and Park Counties
- Active Inventory in November 2018: 7,530
- October 2018 Active Listings: 8,539
- September 2018 Active Listings: 8,807
- August 2018 Active Listings: 8,228
- July 2018 Active Listings: 7,643
- June 2018 Active Listings: 7,436
- May 2018 Active Listings: 6,437
- April 2018 Active Listings: 5,160
- March 2018 Active Listings: 4,619
- February 2018 Active Listings: 4,084
- January 2018 Active Listings: 3,869
- December 2017 Active Listings: 3,854
- November 2017 Active Listing: 5,131
- October 2017 Active Listing: 6,312
- September 2017 Active Listings: 7,586
- August 2017 Active Listings: 7,360
- Median Sales Price for a condo in Denver metro in November 2018: $299,450
- October 2018: $299,250
- September 2018: $301,625
- August 2018: $299,000
- July 2018: $300,000
- June 2018: $305,000
- May 2018: $306,331
- April 2018: $297,000
- March 2018: $295,000
- February 2018: $296,000
- January 2018: $285,000
- December 2017: $285,000
- November 2017: $272,000
- October 2017: $275,000
- September 2017: $268,000
- August 2017 $275,000
- July 2017: $270,100
- Median Sales Price a single-family residence in Denver metro in November 2018 was: $427,000
- October 2018: $435,000
- September 2018: $428,000
- August 2018: $445,000
- July 2018: $450,000
- June 2018: $452,500
- May 2018: $450,000
- April 2018: $455,000
- March 2018: $440,875
- February 2018: $435,000
- January 2018 was $416,000
- December 2017: $415,000
- November 2017: $405,000
- October 2017: $415,000
- September 2017: $409,000
- August 2017: $410,000
- July 2017: $420,000
What’s Happening in Denver:
“If we consider projected downtown job growth and apartment completions, downtown Denver’s ratio should continue to lower, reaching 5.2 jobs per unit by the end of 2019. This is positive news for the residential population seeking out opportunities to live downtown as well as for the companies that have invested in downtown commercial real estate to appeal to that employment base.” – CREJ
Read Denver Metro Association of Realtor’s full report on last month’s Real Estate trends and statistics in Denver here.
And as always, please let us know if you have any questions!


